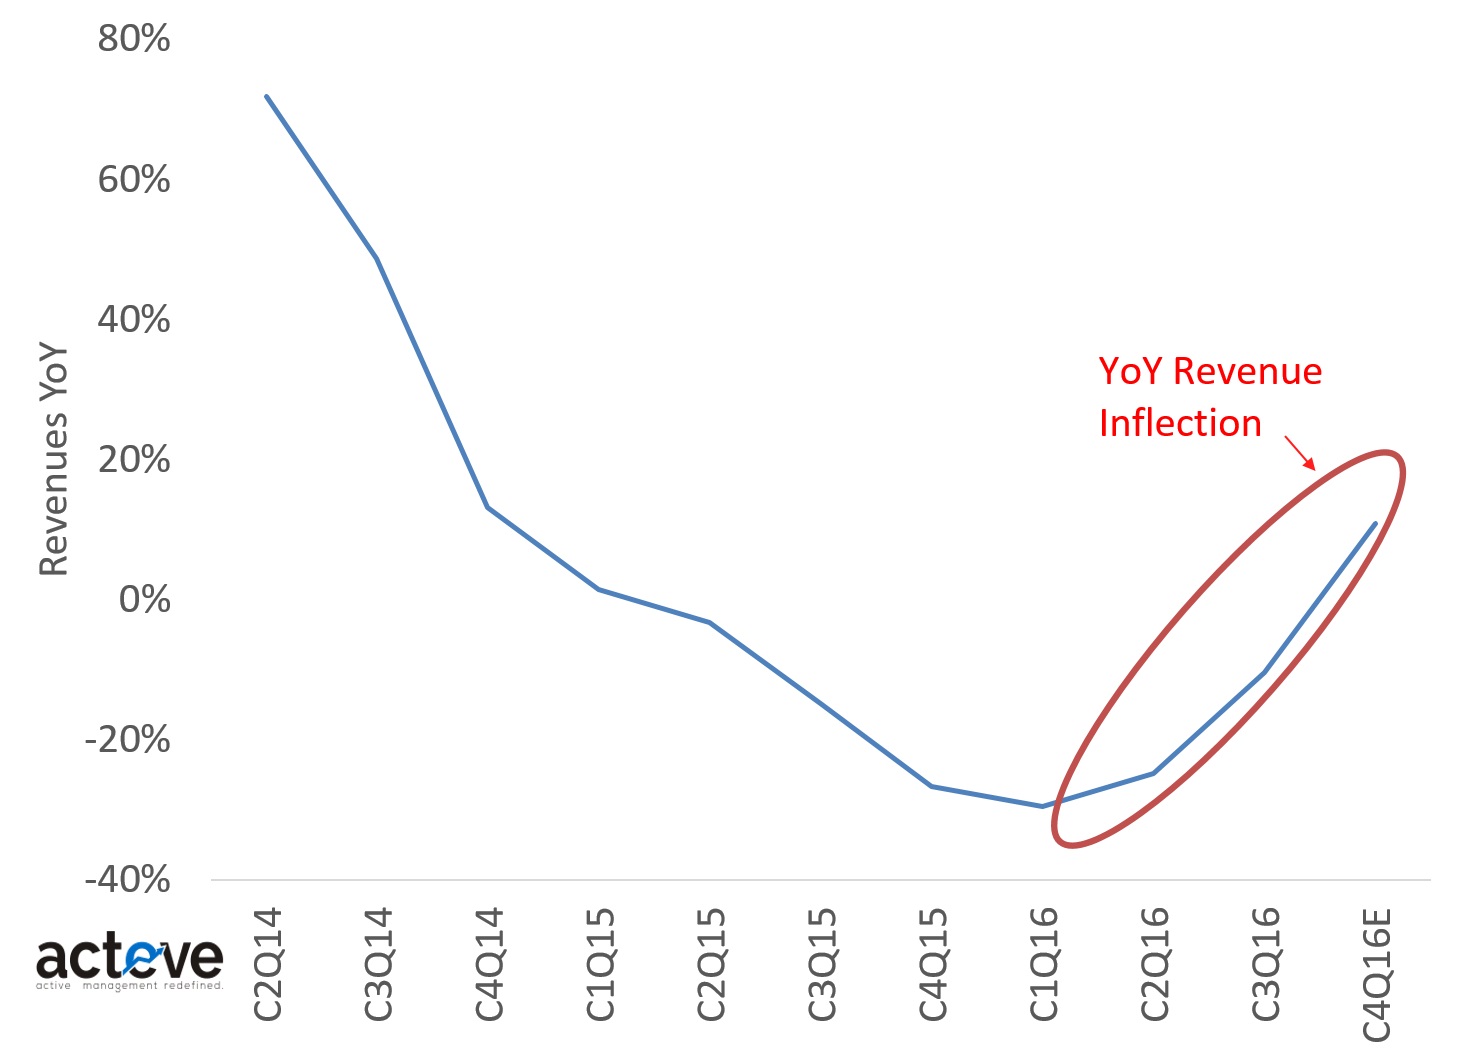
Micron’s F4Q16 (C3Q16) earnings report highlights a YoY revenue inflection (chart below), with YoY revenue growth expected to turn positive next quarter. Both higher bit shipments and prices for DRAM appear to be driving the inflection.

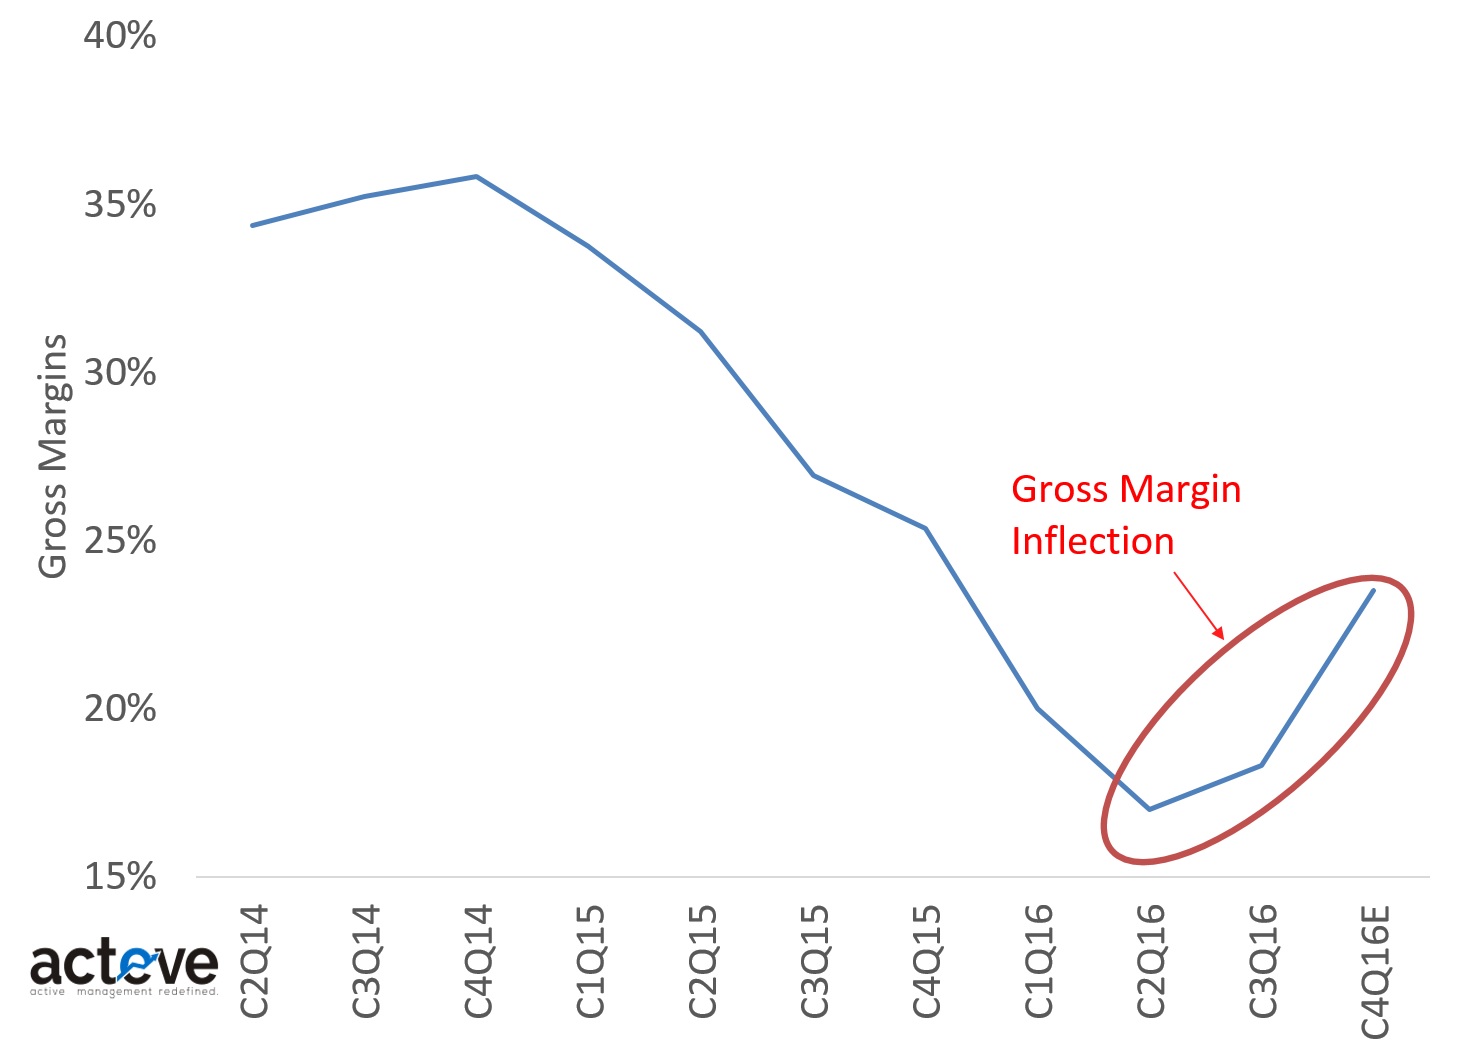
Micron’s gross margins are also inflecting up – the chart below shows quarterly corporate average gross margins, which increased by ~100 bps QoQ in C3Q driven by a ~200 bps improvement in DRAM gross margins. DRAM gross margin improvements resulted from a 6% decline in ASPs more than offset by a 8% reduction in cost per bit. Both a 20% QoQ increase in DRAM bit shipments and a 8% reduction in cost per bit suggest progress was driven by 20nm DRAM ramping into higher volume.

Management guided for 15% QoQ revenue growth and 625 bps of gross margin expansion at the midpoint for C4Q16, and noted industry pricing conditions were favorable and becoming more favorable. However, MU stock traded down ~5% after hours, as momentum traders seemed dissatisfied with the company’s C4Q16 guidance, which includes the effect of accounting changes, as well as a ~1x OpEx step-up. With the stock up ~27% over the last couple of months (and ~90% off its trough earlier this year), expectations had undoubtedly moved higher into the print. Value investors might just get another chance to buy more of the stock if it gets discarded by others in a rush for quick returns.
THIS ARTICLE IS NOT AN EQUITY RESEARCH REPORT.
Disclosure: As of this writing the acteve Model Portfolio (aMP) held a long position in MU.
Additional Disclosures and Disclaimer
Stock market data provided by Sentieo.
Memory market data provided by inSpectrum.


