
The chart shows acteve Model Portfolio (aMP) indexed value (net of fees) vs. the S&P 500 market index (indexed to 10/31/15), as of 6/30/17. The
Category: aMP Performance Update
The chart shows acteve Model Portfolio (aMP) indexed value (net of fees) vs. the S&P 500 market index (indexed to 10/31/15), as of 3/31/17. The
The chart shows acteve Model Portfolio (aMP) indexed value (net of fees) vs. the S&P 500 market index (indexed to 10/31/15), as of 12/31/16. The
The chart shows acteve Model Portfolio (aMP) indexed value (net of fees) vs. the S&P 500 market index (indexed to 10/31/15), as of 9/30/16. The
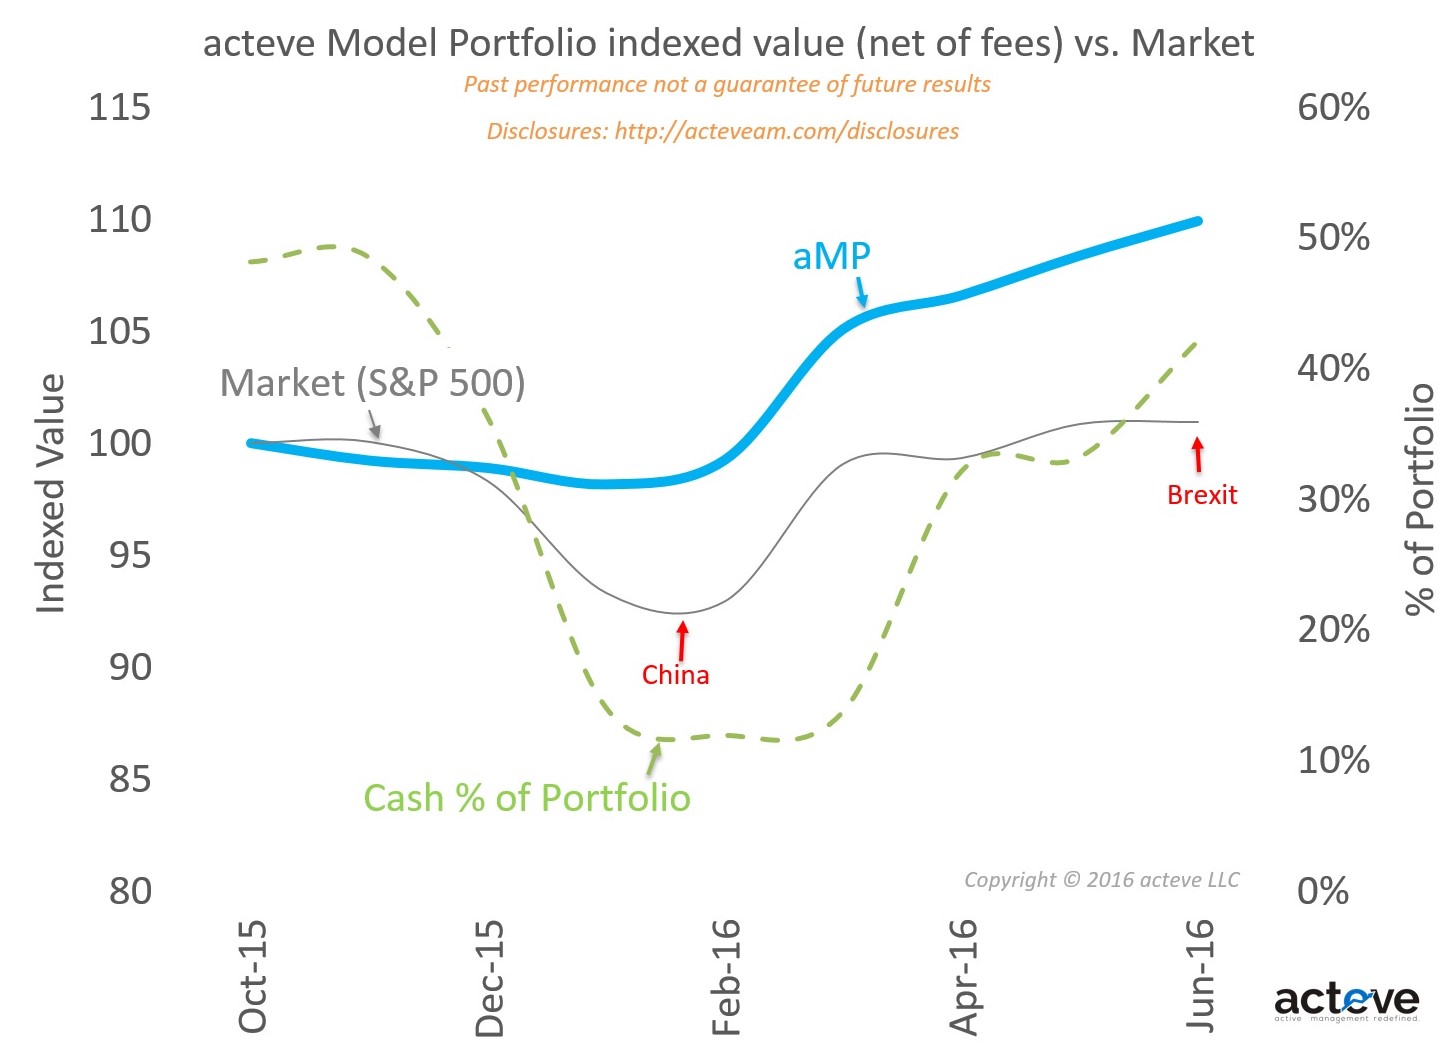
The chart shows acteve Model Portfolio (aMP) indexed value (net of fees) vs. the S&P 500 market index (indexed to 10/31/15), as of 6/30/16. The