
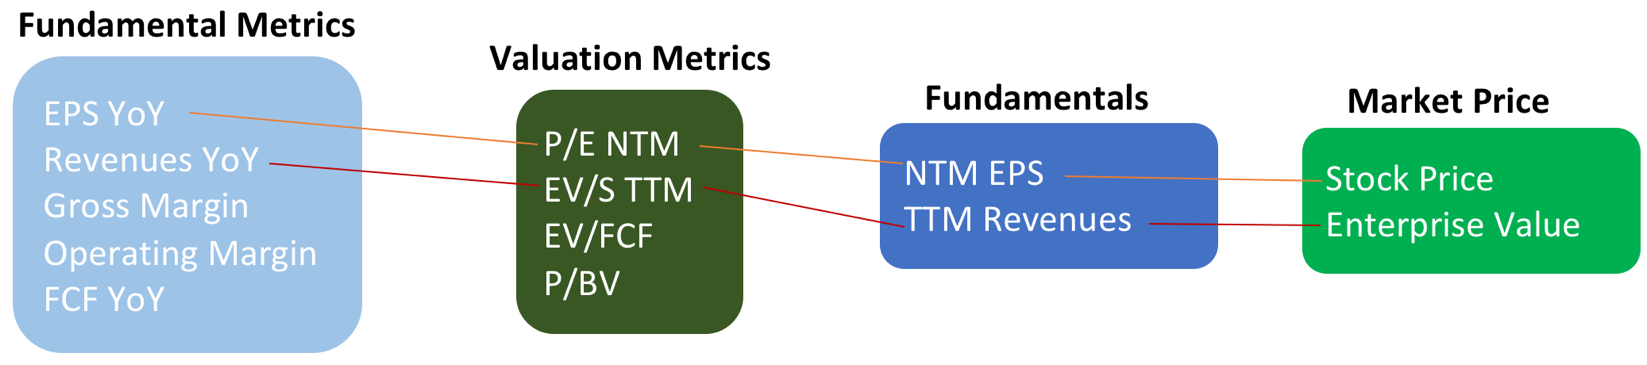
Stock Prices can be linked to business fundamentals through one or more Valuation Metrics. When a given valuation metric is found to track (i.e. correlate with) one or more business fundamental metrics, the stock is said to be “trading on” that (driving) valuation metric. Conversely, when a given valuation metric is found not to track any business fundamental metrics, the stock is said to not be trading on that valuation metric. Once the driving valuation metric is established, the stock price can be determined using that valuation metric. Furthermore, that valuation metric can be used to assess whether the stock is trading at a premium or discount, as in step #2 of my 4SAFEt framework. See the chart below for examples of business fundamental metrics and valuation metrics.
Notes
1. It is commonly assumed (incorrectly) that stocks trade on P/E multiples. For a stock to be viewed as trading on P/E, it must be true that P/E is found to track business fundamental metrics such as EPS growth rate, Revenues YoY, gross margins, etc.
2. When a stock is found to trade on a given valuation metric, other valuation metrics typically turn into “plugs”. A plug is a mathematical back-calculation from a given stock price, which would be set by the driving valuation metric the stock is said to be trading on. For example, if a stock is trading on EV/S TTM, then its P/E NTM would be a plug . The stock price would be determined by first estimating EV/S based on the underlying business fundamental metric it is tracking (e.g. revenues YoY). Once the stock price is determined, the P/E is back-calculated.
3. Stocks can trade on different valuation metrics during different time periods. This could occur for a variety of reasons, including reasons noted below:
a. Loss of ability to consistently generate EPS.
b. Perceived change in business profile due to M&A.
c. Perceived change in business profile due to product cycles.
d. Perceived change in corporate vision, management ability to execute, etc.
e. Business agreements, trade alliances or partnerships.
f. Perceived change in industry structure due to consolidation or other changes in customer/supplier power.
4. A given stock could appear to be trading on more than one valuation metric at the same time. For example, a stock could be trading on both P/E NTM and EV/S TTM simultaneously. This just means that the market price is tracking more fundamental metrics, rather than just a single metric. That’s a good thing!
Definitions
Market Cap = Enterprise Value (EV) + Cash – Debt.
Stock Price (P) = Market Cap / Shares Outstanding.
P/E = Stock Price / EPS.
NTM = Next Twelve Months.
TTM = Trailing Twelve Months.