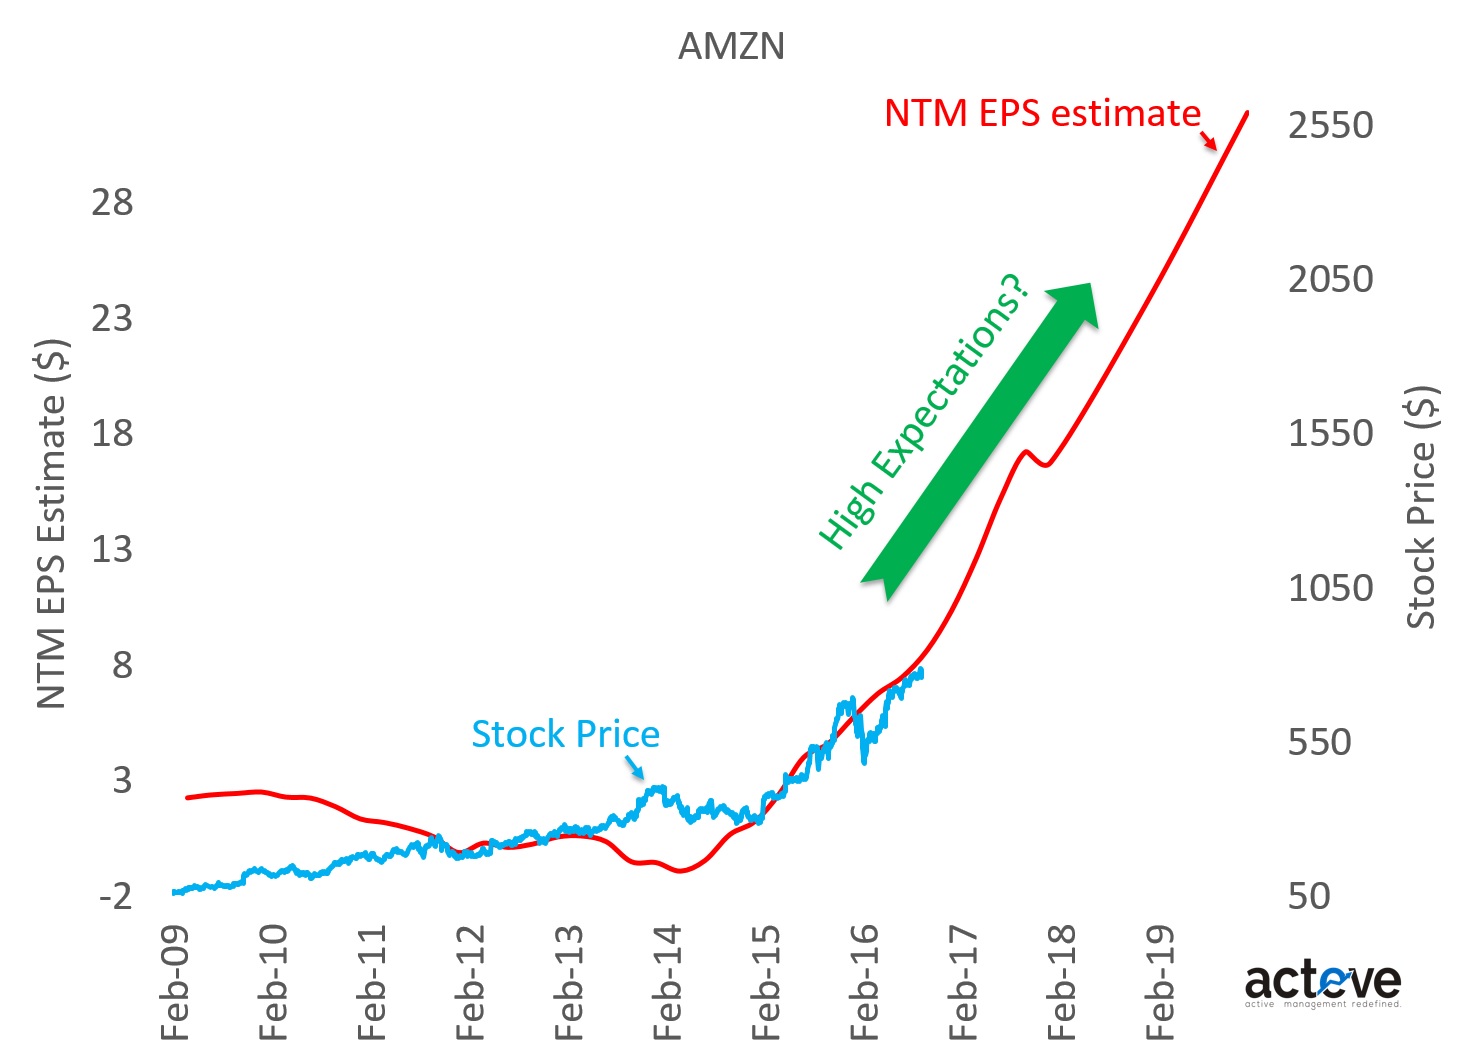
Let’s assume that sellside estimates are representative of investor expectations for $AMZN (as discussed in my book, that is not always the case). The NTM EPS chart below shows consensus projections through 2020. Sellside EPS estimates reflect expectations for continued strong, if not accelerating EPS growth over the next few years.

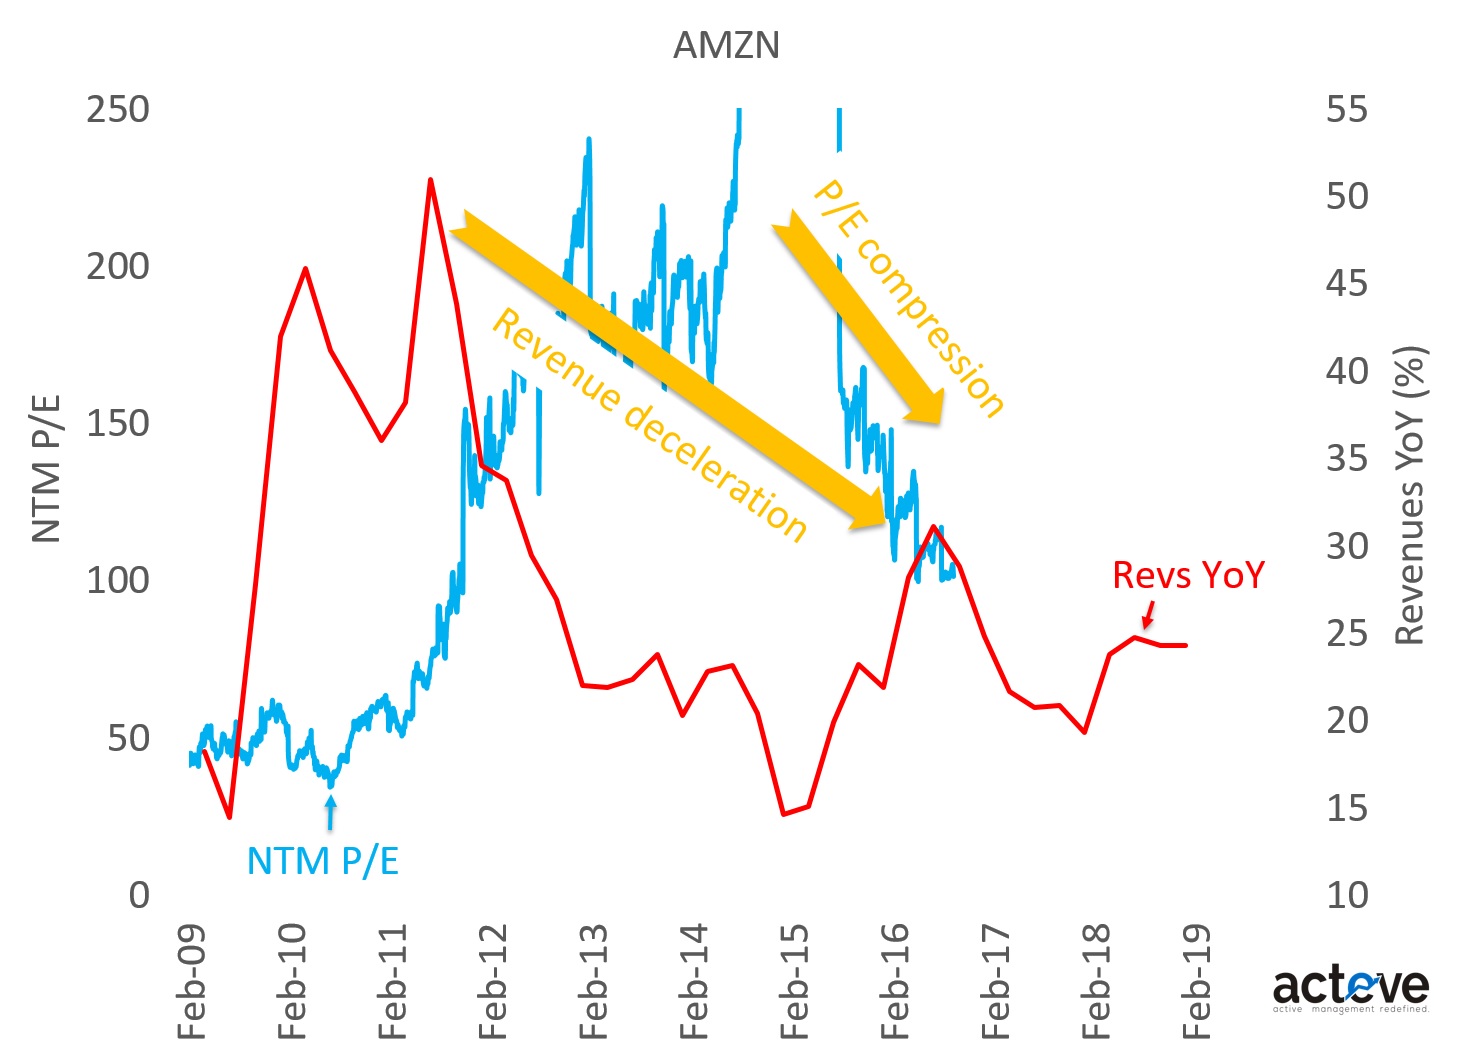
Now look at the NTM P/E chart. AMZN’s P/E has compressed by ~50% since 2014 from ~200x to ~100x, perhaps driven in part by deceleration in YoY revenues. Without concerning ourselves too much about whether 100x is or isn’t the right multiple for the stock, it seems clear that expectations for further revenue deceleration over the next couple of years are unlikely to drive the P/E higher than 100x.

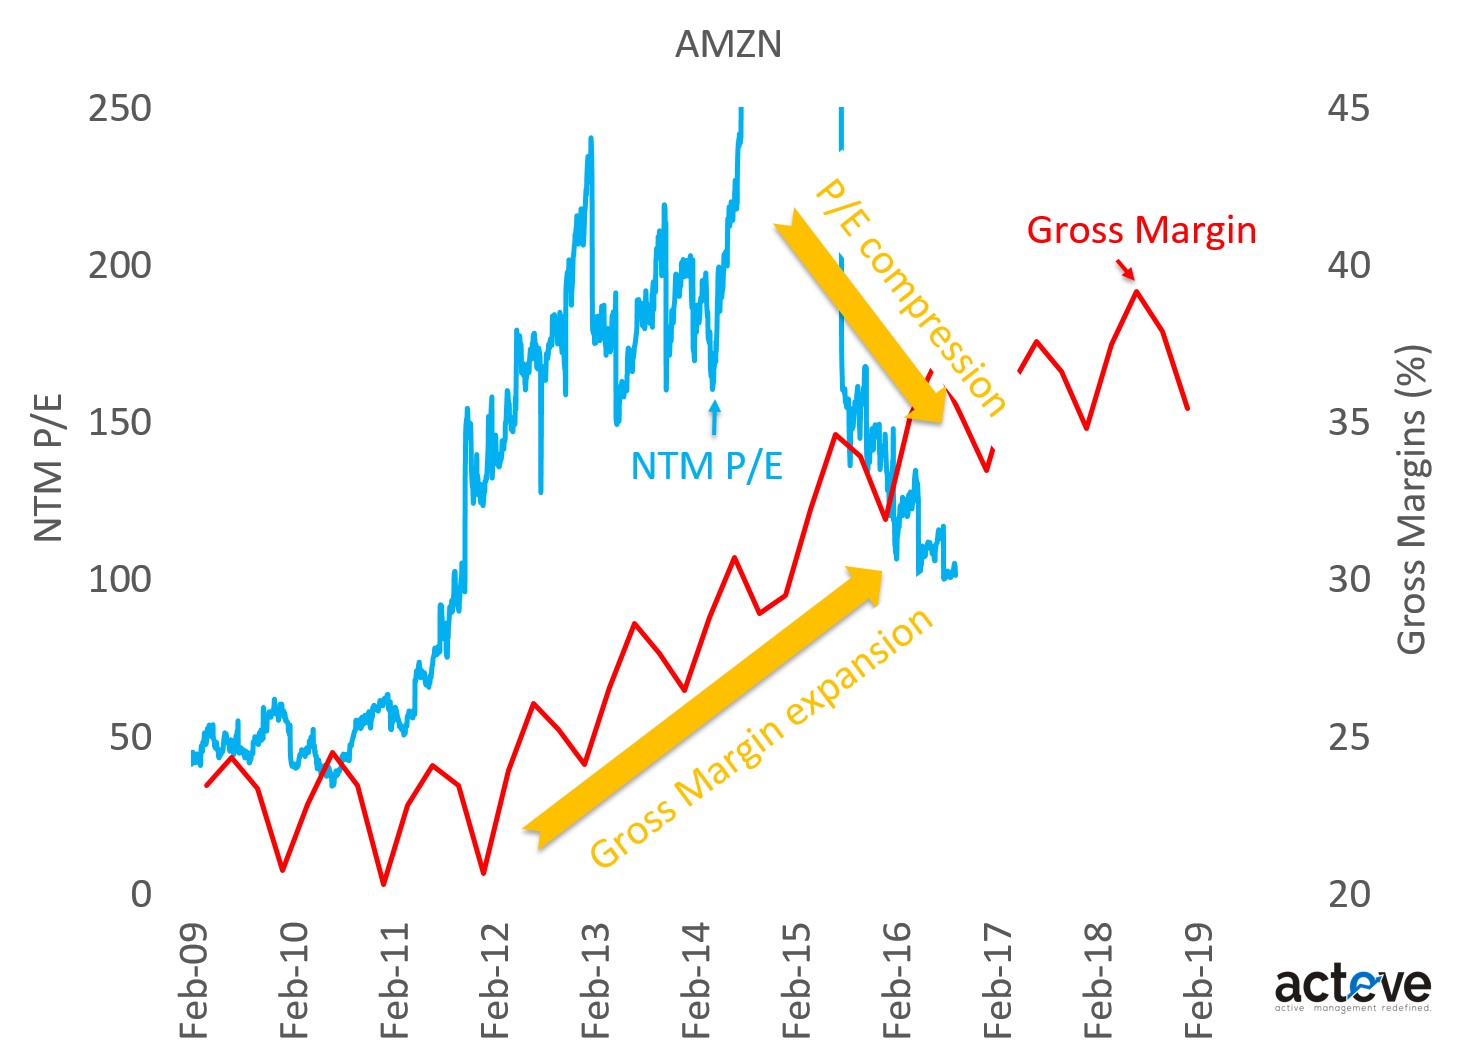
Amazon seems to have done a great job growing both revenues and gross margins (chart below) over the last few years. But as the charts show, investors have rewarded the stock with a lower valuation multiple in return, as gross margin expansion was not able to offset revenue deceleration to allow the valuation multiple to hold steady.

One interpretation of this dynamic would be that investors are less optimistic about Amazon’s future fundamentals than those reflected in sellside estimates. Still, given the momentum effect in a popular stock like AMZN, it is hard to imagine investor greed unwinding in an orderly fashion, especially if there is an unexpected macro dislocation.
THIS ARTICLE IS NOT AN EQUITY RESEARCH REPORT.
Disclosure: As of this writing the acteve Model Portfolio (aMP) did not hold any positions in AMZN.
Additional Disclosures and Disclaimer
Stock market data provided by Sentieo.


