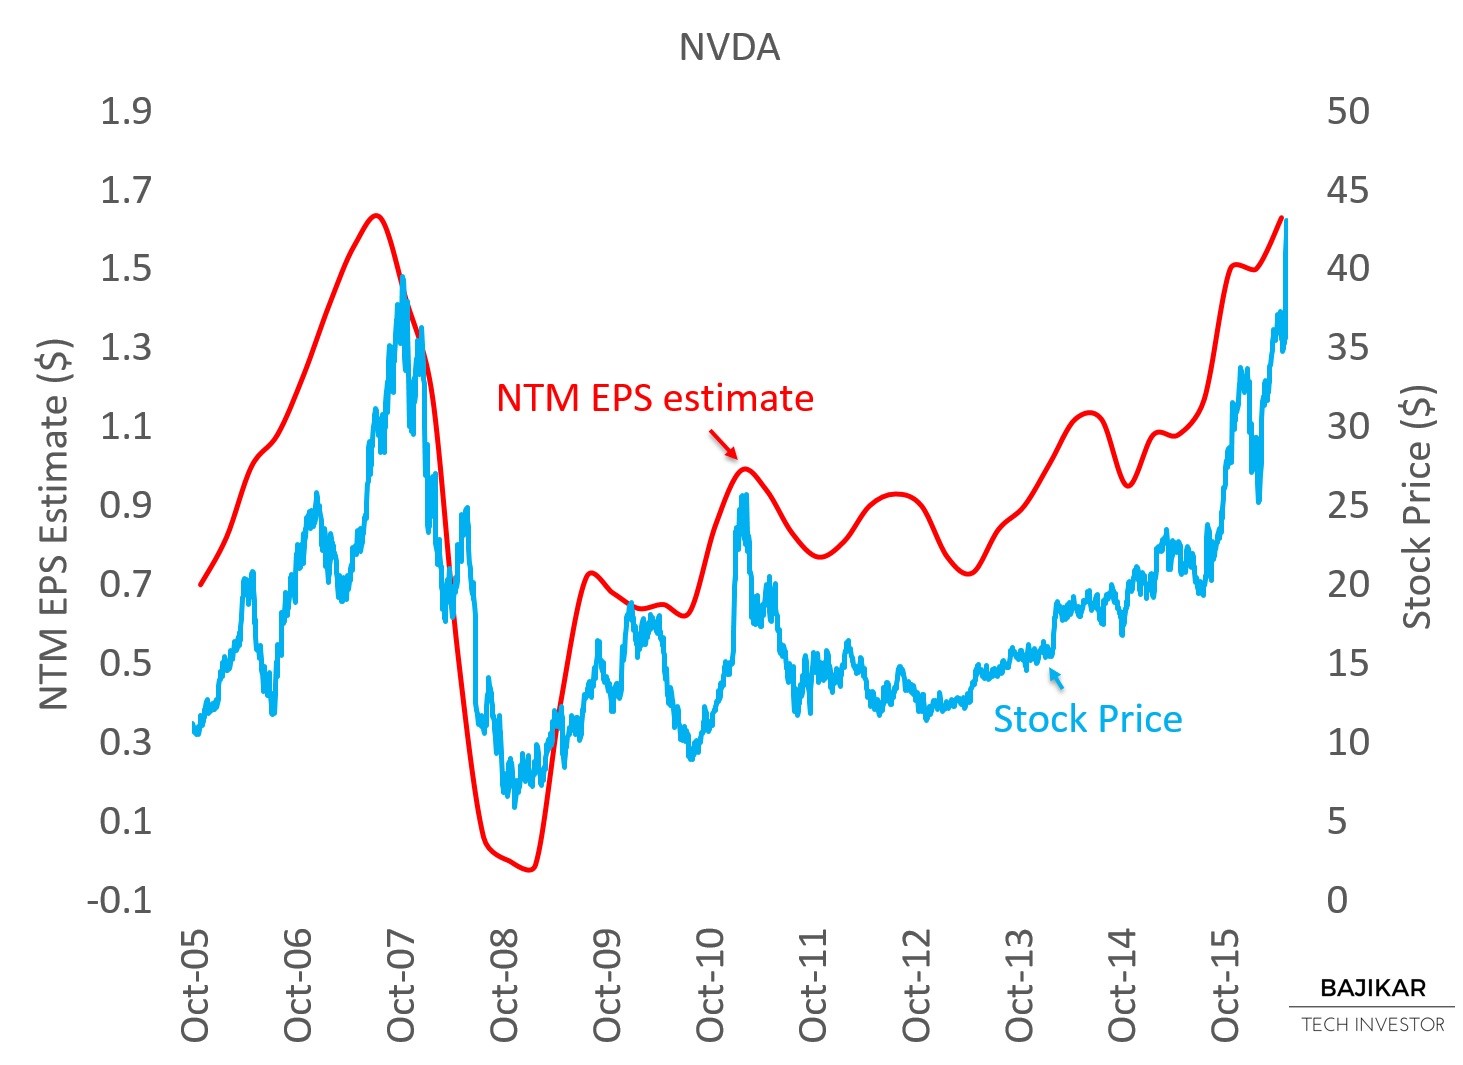
The chart below compares NVDA stock price performance with NTM EPS forecasts over the last 10 years. After tracking EPS forecasts closely until mid-2010, NVDA stock underperformed EPS forecasts until recently. The chart suggests NVDA stock is finally caught up with EPS forecasts, which have generally moved higher over the last ~5 years, as gaming, Cloud and self-driving car products increasingly moved into the spotlight.
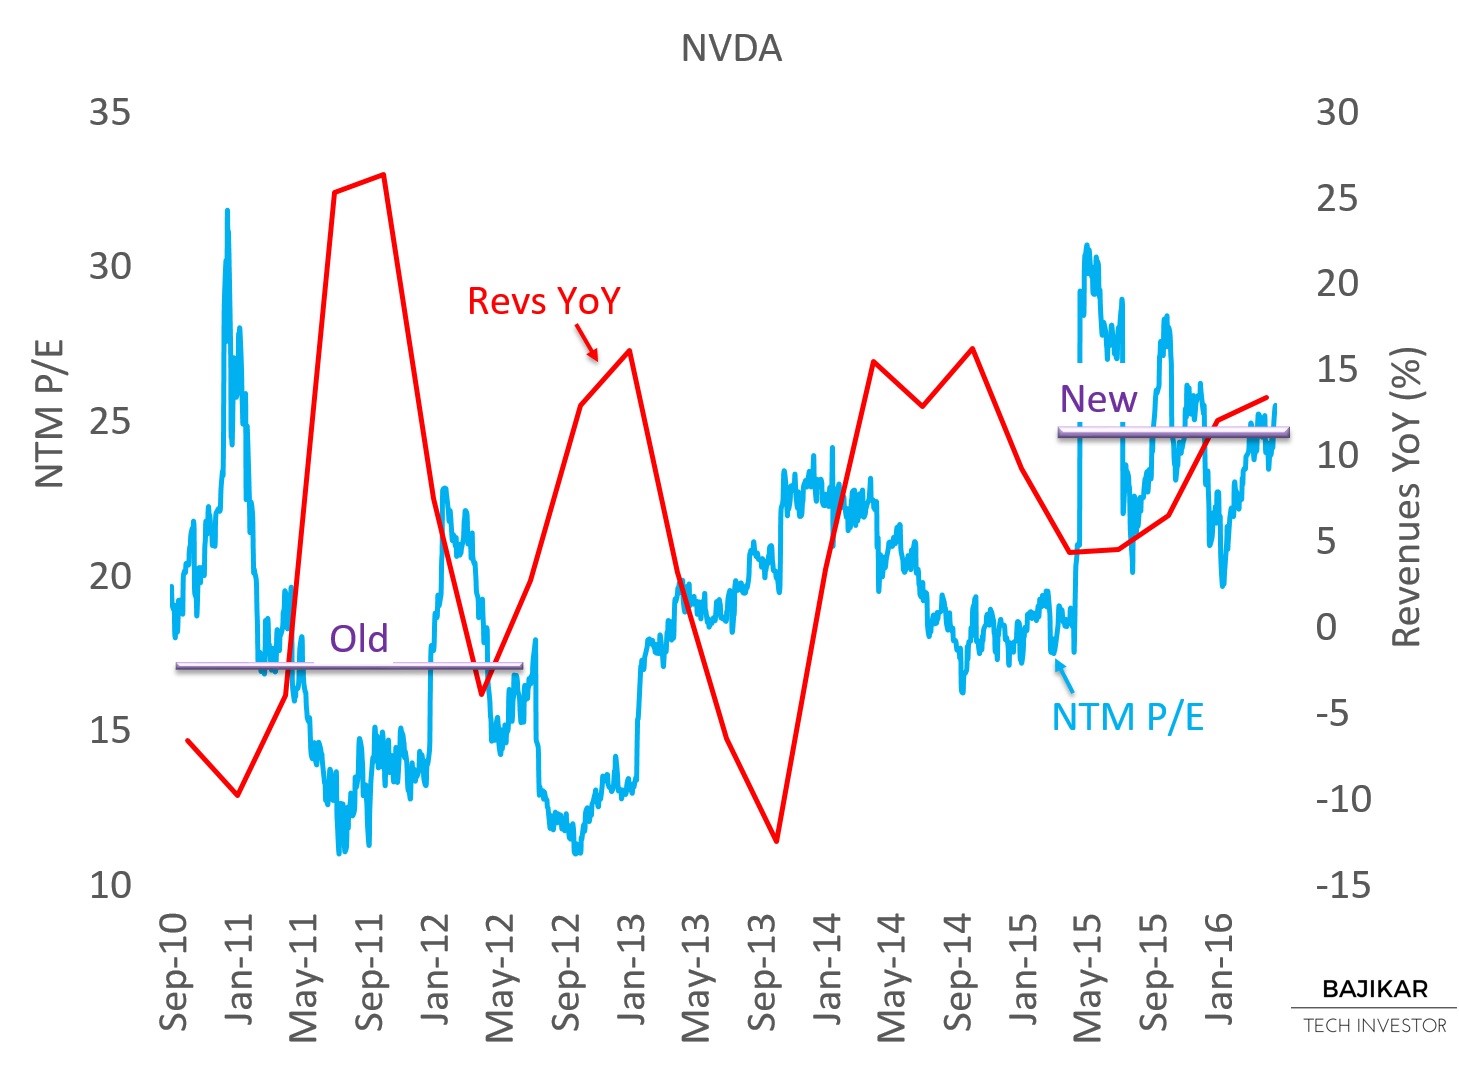
The chart below suggests NVDA’s valuation multiple has rerated higher, from NTM P/E of ~17x (~2010-12) to ~25x over the last year. While this means the stock is now potentially getting appropriate credit for the company’s transformation following its PC chipset debacle, it also means that investor expectations have increased, and the company could find it incrementally harder to deliver upside surprises even if strong growth continues.
NVDA’s multiple expansion may have come at least in part at the expense of MBLY, which saw its valuation multiple compress over the same period, potentially due to competition from Nvidia in the fast moving self-driving car market.
THIS ARTICLE IS NOT AN EQUITY RESEARCH REPORT.
Disclosure: At the time of this writing, the acteve Model Portfolio did not hold any positions in NVDA or MBLY stocks. I am collaborating with Counterpoint Technology Market Research to develop proprietary reports that analyze the rapidly evolving self-driving car market in more detail.
Additional Disclosures and Disclaimer
Source: Stock market data provided by Sentieo.