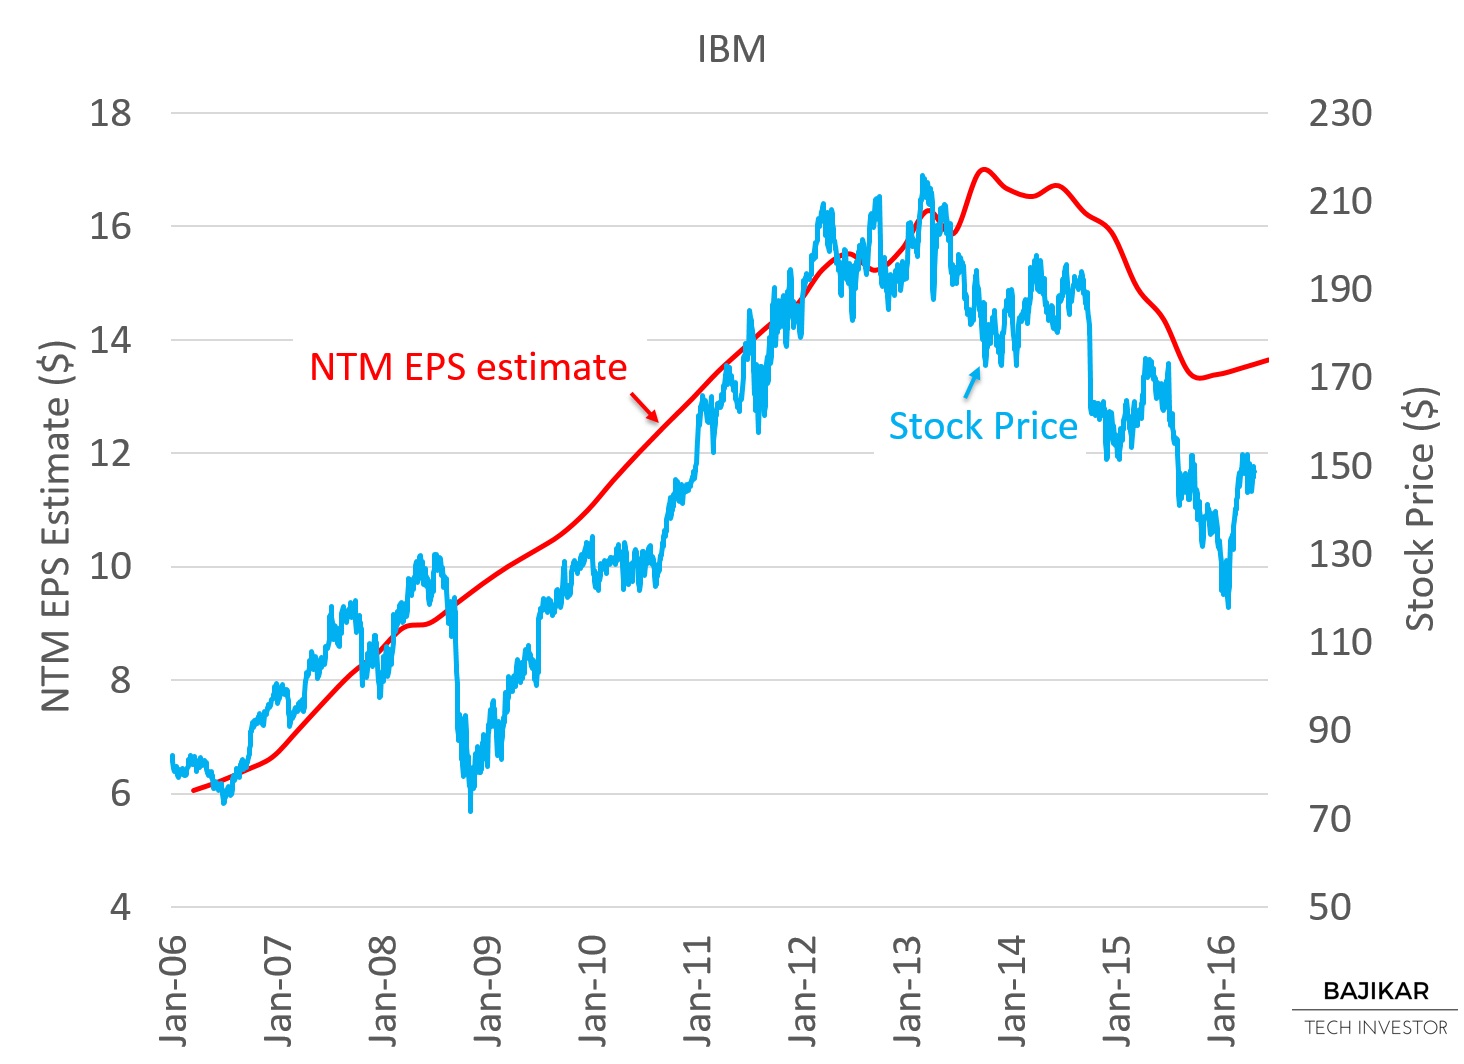
The chart below suggests that over the last 10 years, IBM’s stock price has tracked NTM EPS estimates with occasional periods of divergence. Over the last few years IBM’s stock price tracked below NTM EPS estimates, as IBM’s P/E valuation multiple compressed.
The chart below suggests that over the last 10 years, IBM’s P/E tracked its quarterly YoY Revenues, which declined since 2012. Over the last few months, IBM’s P/E expanded, helped by an inflection in YoY Revenues. Note that IBM’s quarterly revenues are still declining YoY, just at a slower rate than they did over the last few years.
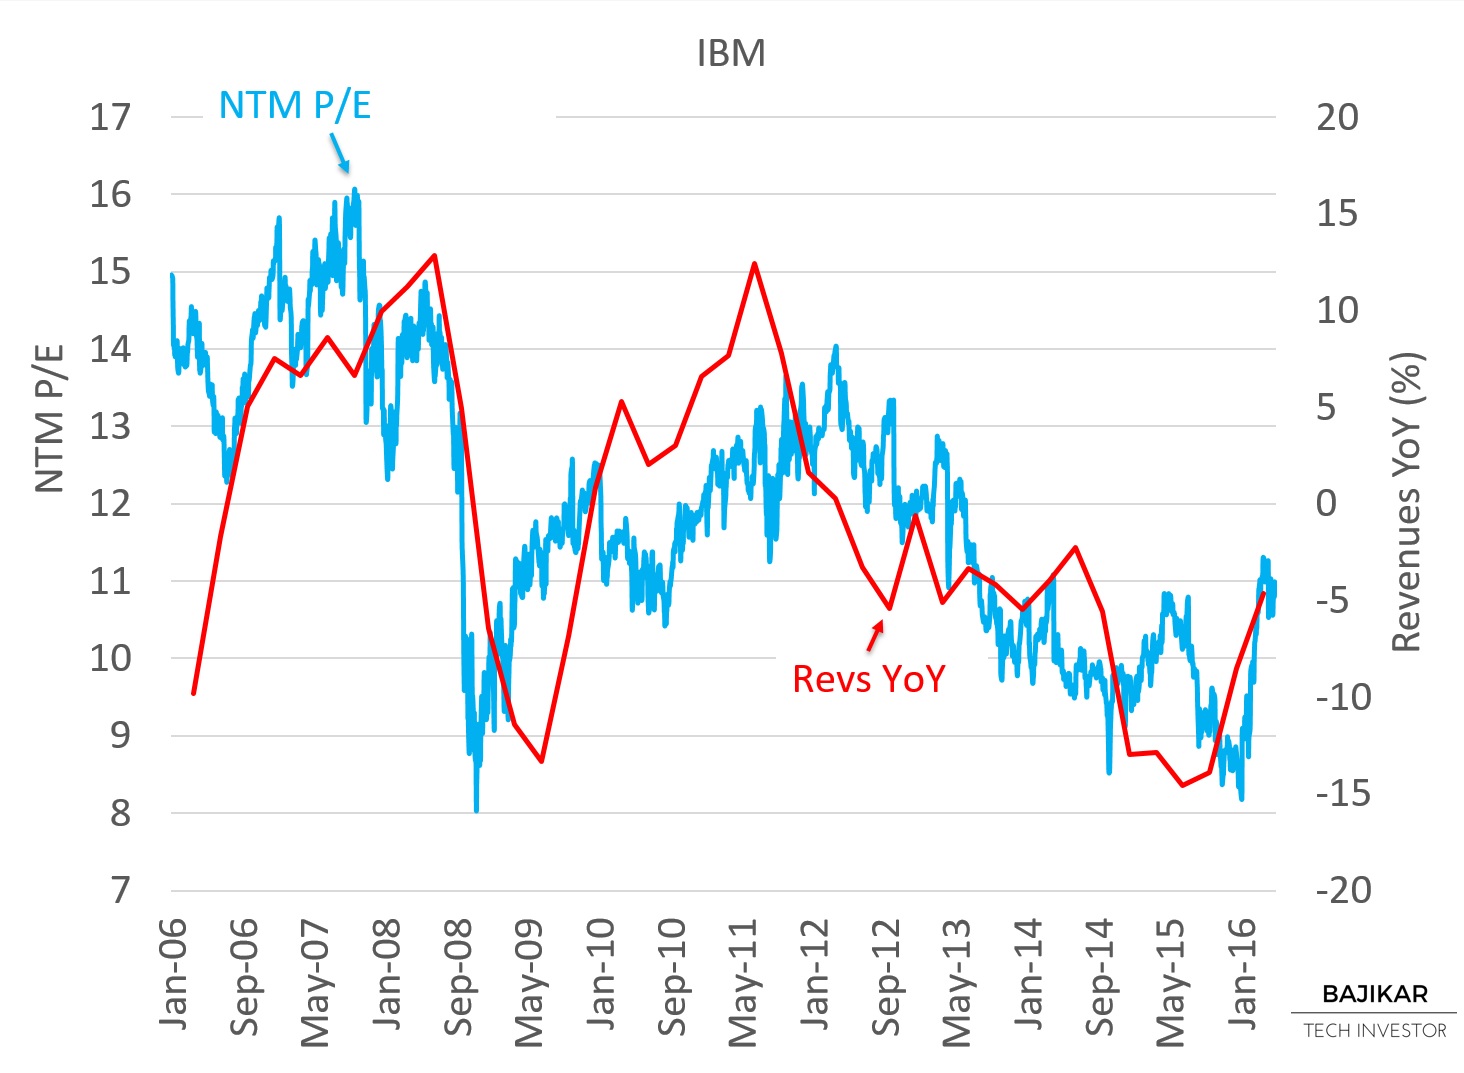
YoY Revenue growth is viewed as a momentum indicator. Positive momentum can drive expansion of the valuation multiple, while negative momentum typically drives multiple compression. In the case of IBM, YoY Revenue started to inflect in late-2015, signaling potential opportunity for a value investor to establish (or add to) position in the stock.
THIS ARTICLE IS NOT AN EQUITY RESEARCH REPORT.
Disclosure: At the time of this writing, the acteve Model Portfolio held long positions in IBM stock.
Additional Disclosures and Disclaimer
Source: Stock market data provided by Sentieo.