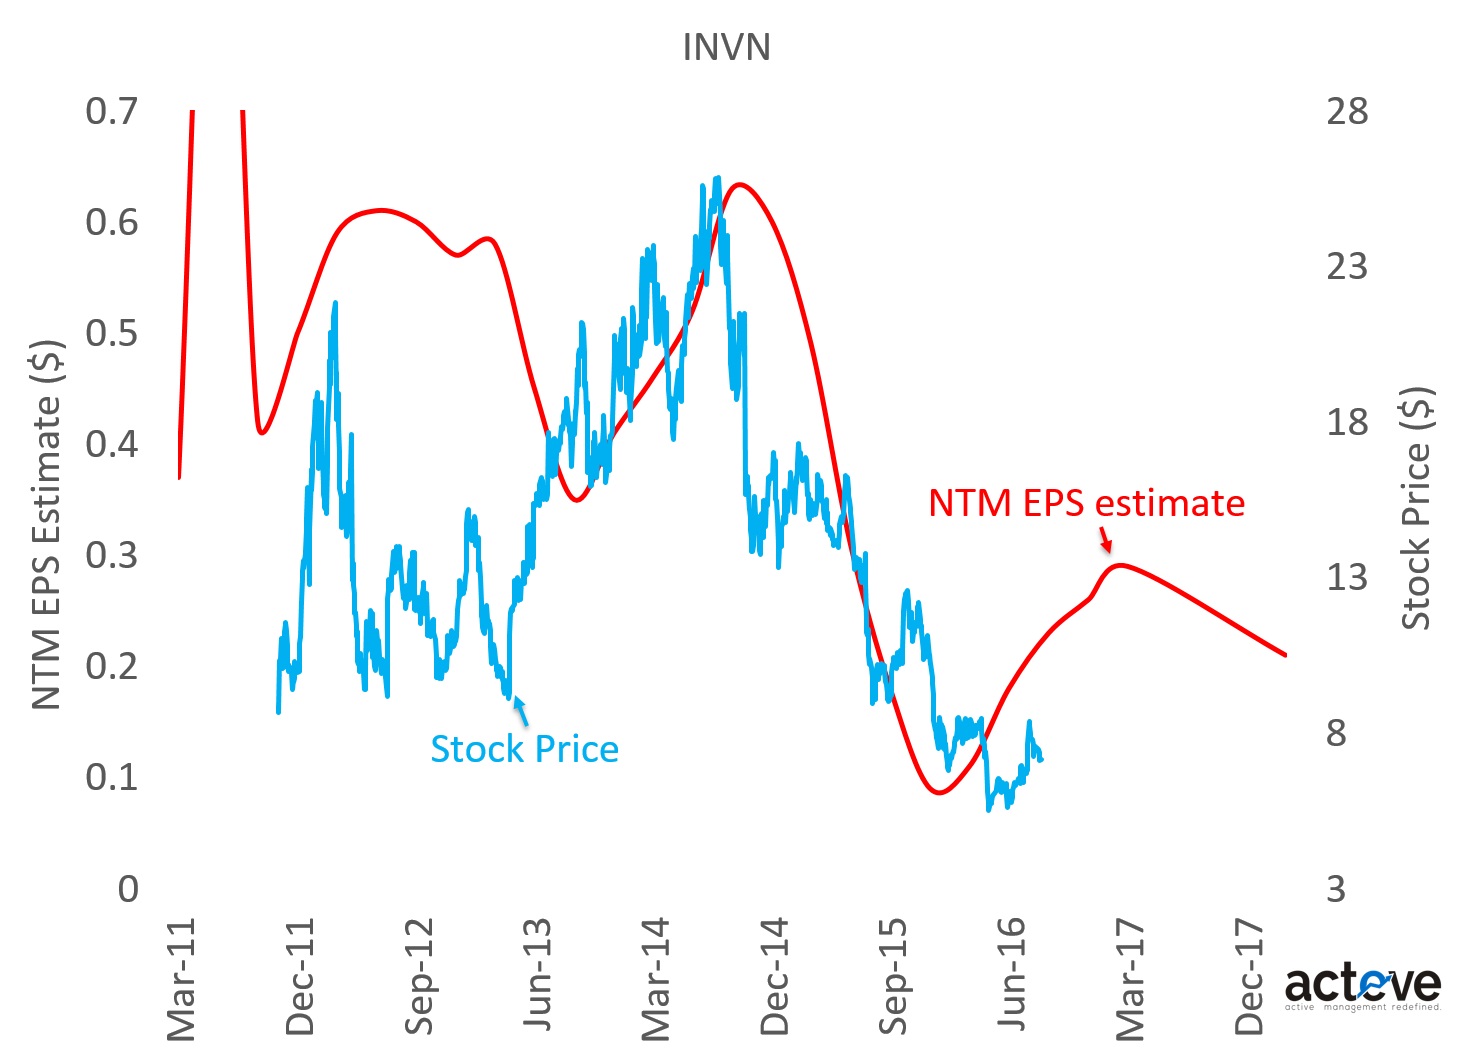
The chart below suggests that INVN stock price is tracking below NTM EPS projections, an understandable dynamic following severe dislocation in Invensense’s gyro/OIS market share, particularly in Samsung smartphone.
Invensense experienced elevated pricing pressure surrounding its loss of market share at Samsung. Pricing pressure translated into lower gross margins. At EV/S of ~1.8x investors seem to be implicitly assuming that the company’s historical revenue/margin challenges are likely to continue.
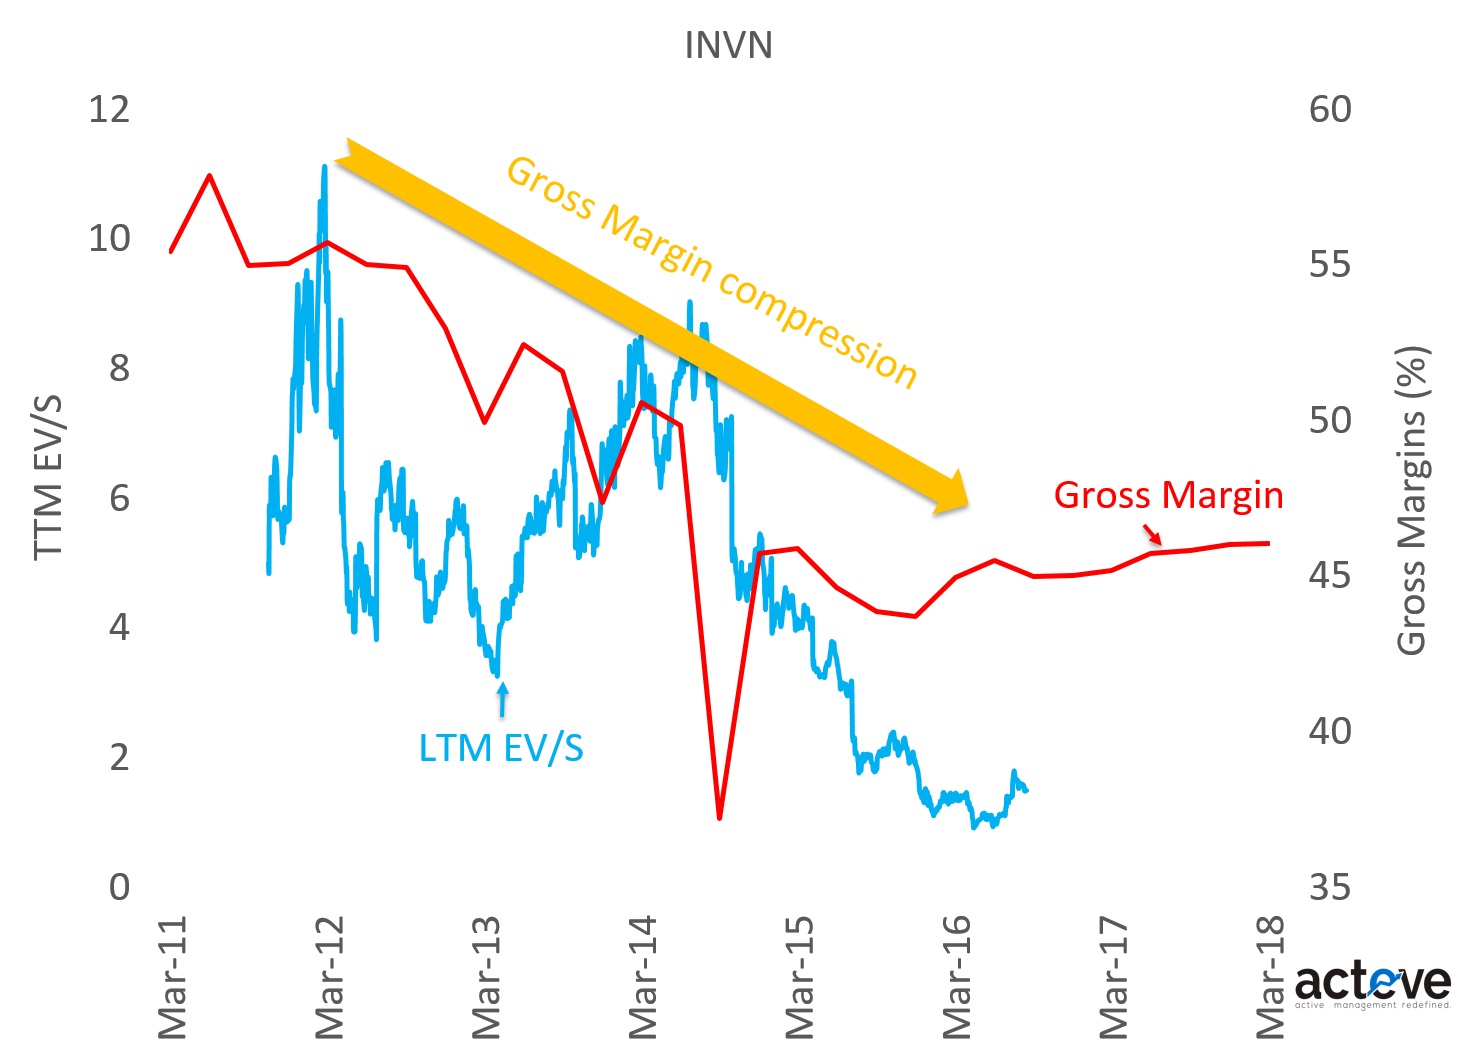
As the chart suggests, the worst of the pricing pressure appears to be behind the company, with smartphone share having stabilized, and non-smartphone categories (e.g. IoT) growing. As gross margins stabilize or expand, primarily due to growth in new categories like VR/AR, self-driving car, etc., the stock’s valuation (EV/S multiple) could also start approaching its historical range.
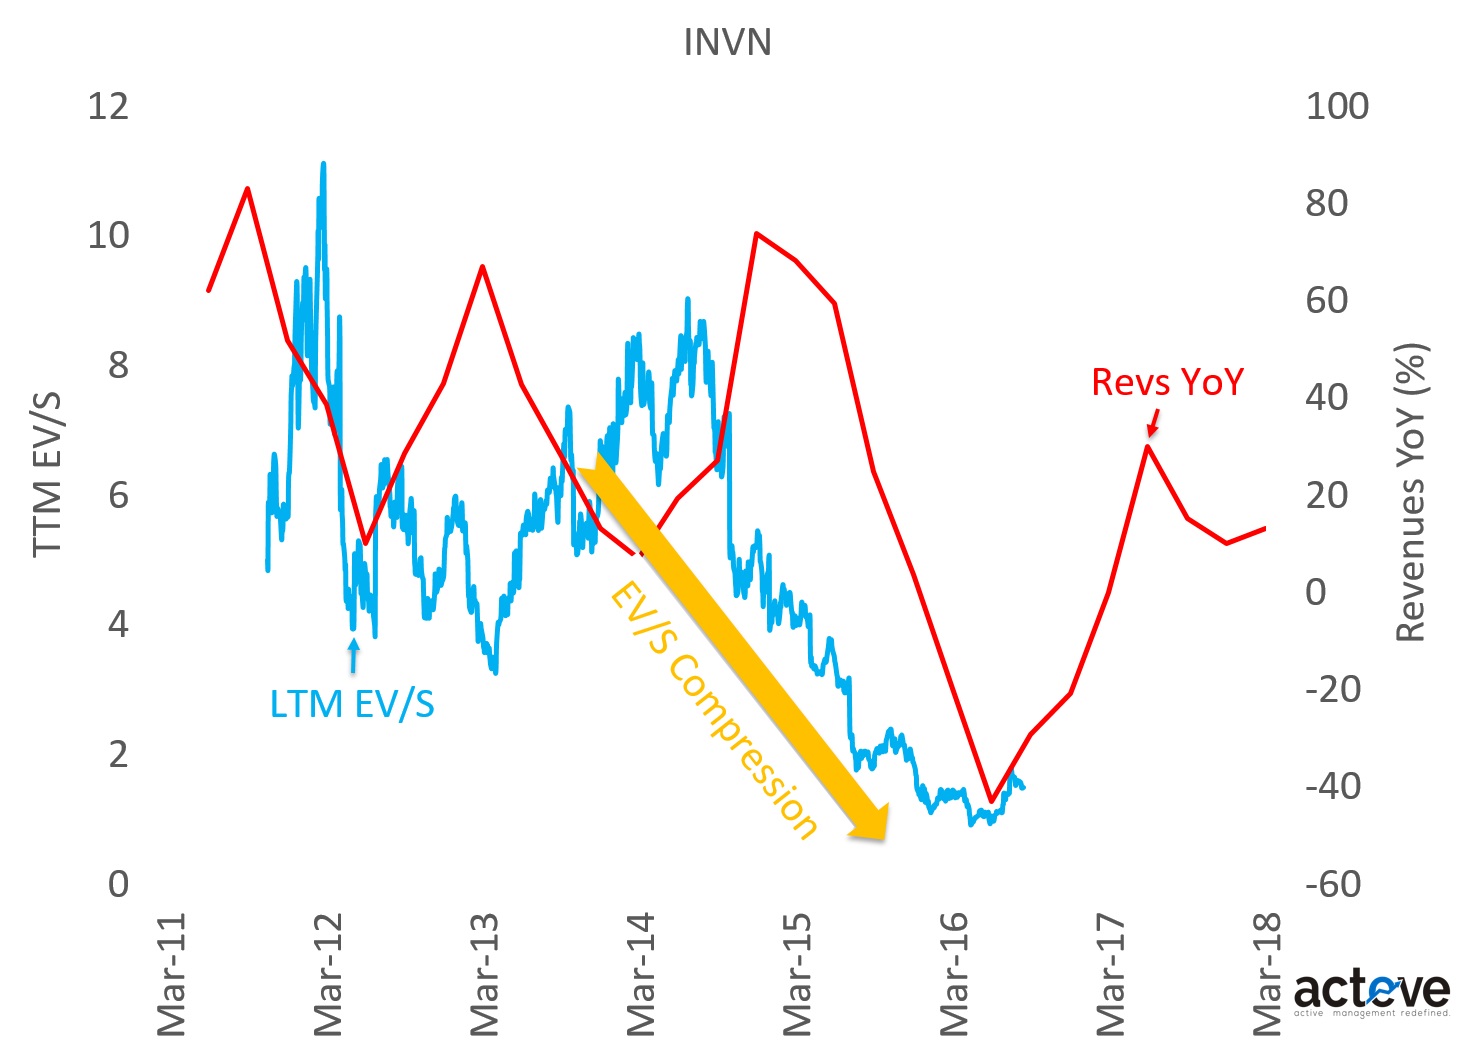
Stronger support for the valuation multiple could come from an inflection in YoY revenues, as the chart above illustrates. Better than expected iPhone 7/Plus shipments would help the revenue recovery, assuming no further share loss at Samsung.
THIS ARTICLE IS NOT AN EQUITY RESEARCH REPORT.
Disclosure: As of this writing the acteve Model Portfolio (aMP) held a long position in INVN.
Additional Disclosures and Disclaimer
Stock market data provided by Sentieo.