The chart shows acteve Model Portfolio (aMP) indexed value (net of fees) vs. the S&P 500 market index (indexed to 10/31/15), as of 3/31/17. The chart also shows the cash allocation in the portfolio. As of 3/31/17, more than 50% of aMP assets were held in cash, given my view that the market environment was generally overvalued. Performance data are shared consistent with acteve’s philosophy of delivering superior transparency.
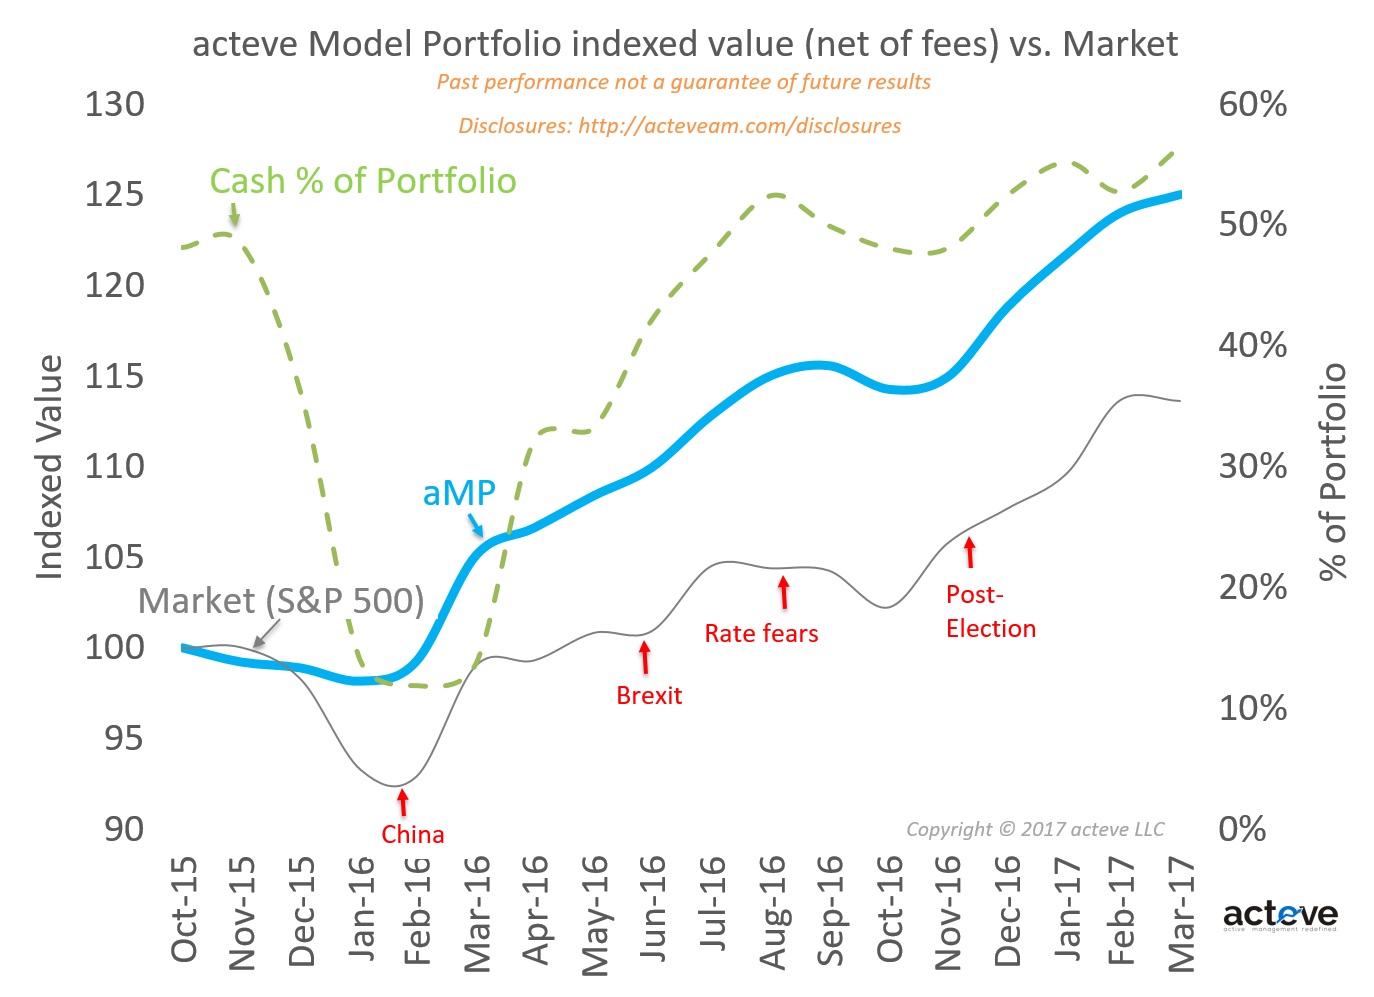
Note that the aMP was conceived in October 2015, after I left sellside equity research. Consistent with acteve’s philosophy of disciplined, patient, and mindful investing, the aMP will continue to be managed with a long-term horizon. In other words, past performance shown in the chart was not a result of maximizing short-term performance.
Fees are deducted at the maximum annual rate of 1% at the end of each calendar quarter in arrears, based on quarter ending account value. Accordingly, the chart reflects withdrawal of fees on 12/31/15, 3/31/16, 6/30/16, 9/30/16, 12/31/16 and 3/31/17 for the three-month periods ending on those dates respectively.
Please note:
The performance is derived from the portfolio manager’s separate account and assumes the maximum level of fees (1%) acteve may charge. The featured account was selected because it most accurately reflects the investment objective of the acteve strategy. The remaining accounts that were not included were purposefully omitted, as they deviate from the investment objective of the strategy. Due to various factors, including changing market conditions, such performance may no longer be reflective of current position(s) and/or recommendation(s). Moreover, no client or prospective client should assume that any such discussion serves as the receipt of, or a substitute for, personalized advice from our firm or from any other investment professional. Please contact us for a current and complete list of portfolio holdings.
S&P 500 Index is widely regarded as a gauge of the U.S. equities market. This index includes a representative sample of 500 companies in the leading industries of the U.S. economy. Although the S&P 500 Index focuses on the large‐cap segment of the market, with approximately 75% coverage of the U.S. equities, it is also a proxy for the total market. An investor cannot invest directly in an index.
Investing involves a high degree of risk and possible loss of principal capital. This presentation is solely for informational purposes. The results reflect the reinvestment of dividends and other earnings. Past performance is no guarantee of future returns. No advice may be rendered by acteve LLC unless a client service agreement is in place. Please contact us at your earliest convenience with any questions regarding the content of this presentation. Investors are urged to consult a professional advisor regarding the possible economic, tax, legal or other consequences of entering into any investments or transactions described herein.
Disclosures and Disclaimer