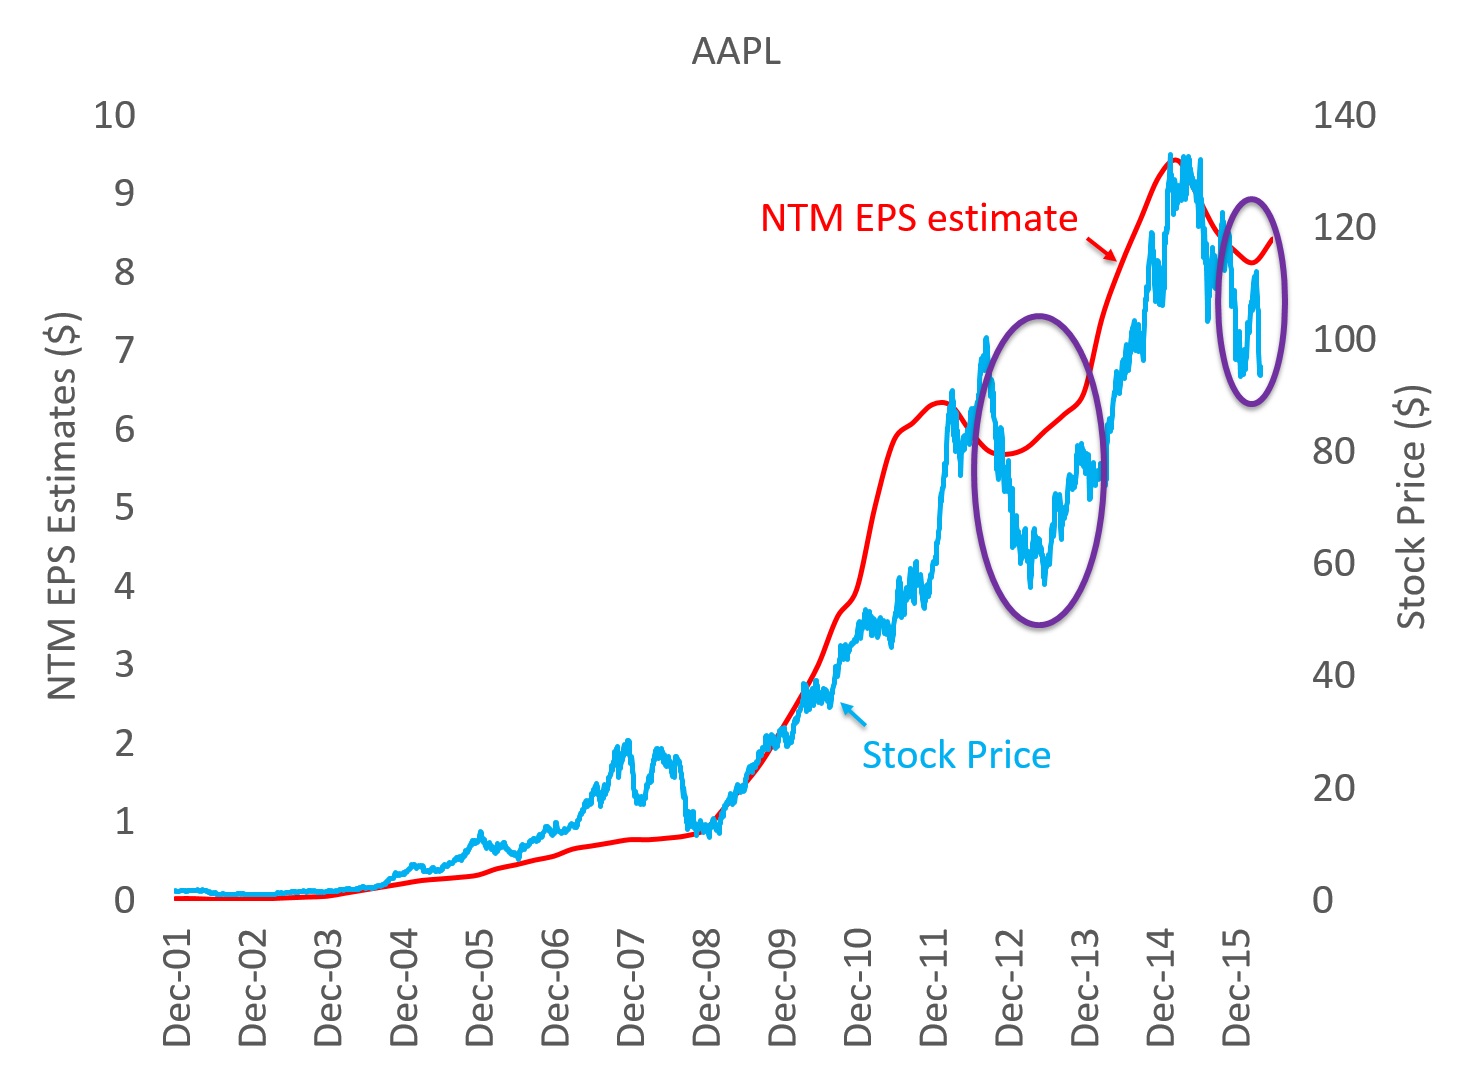
The chart below suggests that AAPL stock’s recent negative reaction to estimate cuts is similar to its behavior following product/earnings disappointments in 2013.
The chart below suggests that AAPL stock’s recent negative reaction to estimate cuts included a compression of its NTM P/E multiple, similar to its behavior following product/earnings disappointments in 2013.
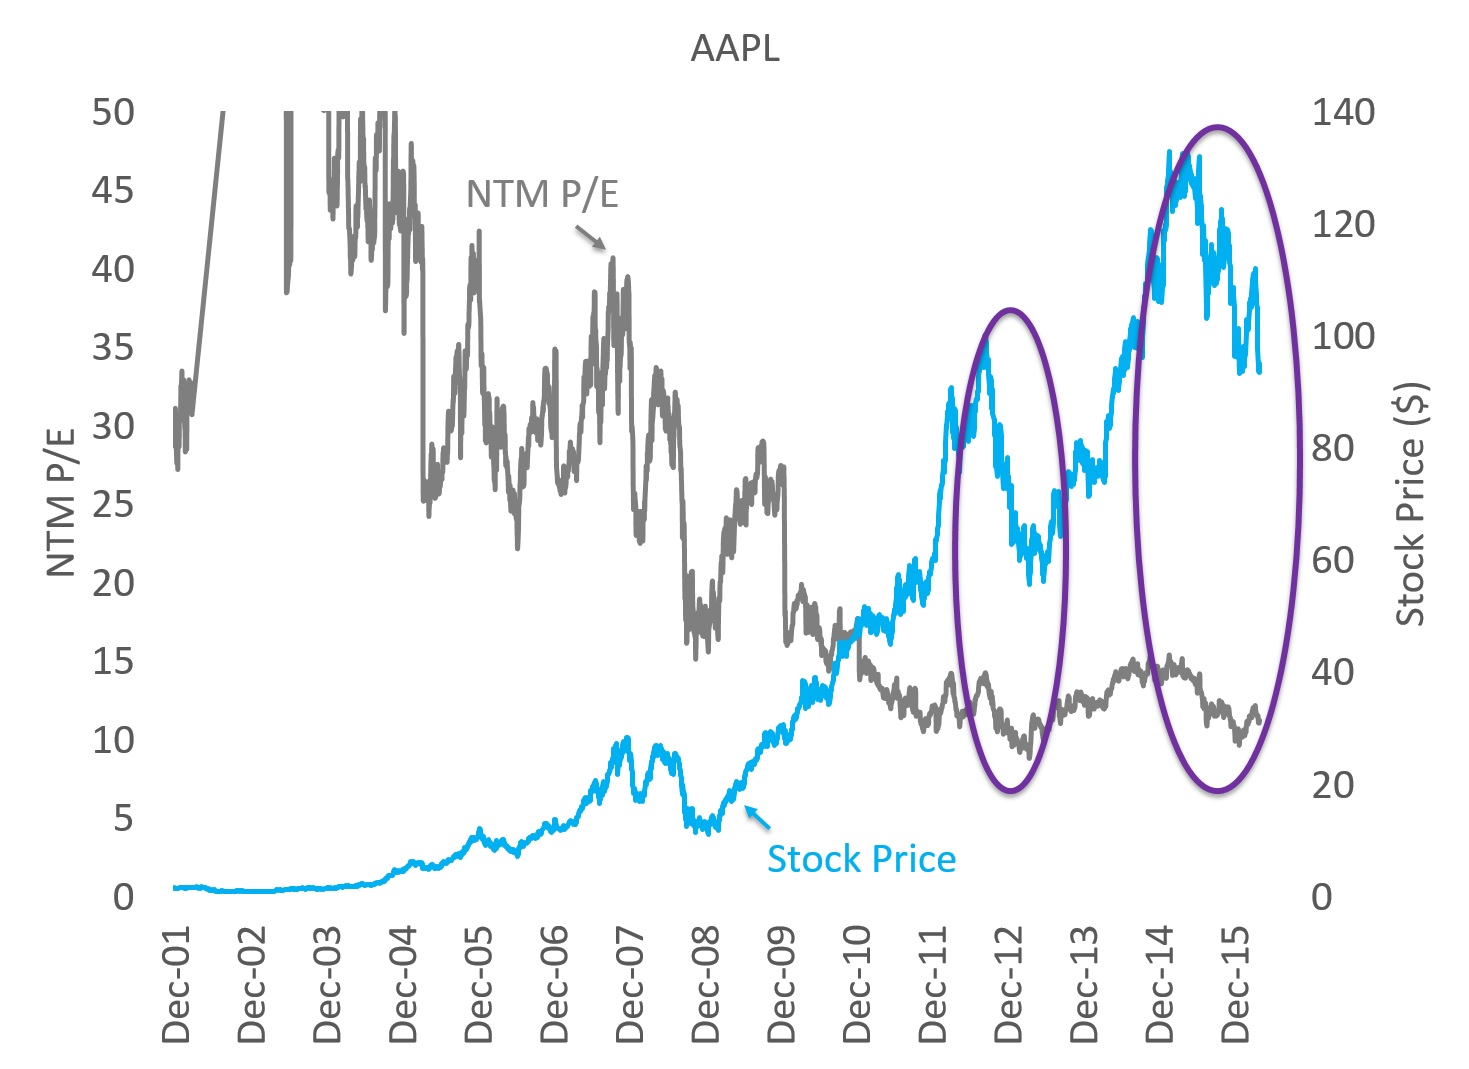
The two charts effectively show the same information in different formats. NTM EPS (next-12-month Earnings per share) represents the consensus estimate of EPS forecast for the next year. In other words, it captures near-term expectations of earnings power. NTM P/E is a Price to Earnings multiple calculated using NTM EPS in the denominator. When disappointment strikes, potential degradation of fundamentals (as measured by NTM EPS) is amplified by “multiple compression”. Together, these dynamics cause a stock to decline a lot more than would otherwise make sense to a long-term investor.
THIS ARTICLE IS NOT AN EQUITY RESEARCH REPORT.
Disclosure: At the time of this writing, the acteve Model Portfolio held long positions in AAPL stock.
Additional Disclosures and Disclaimer
Source: Stock market data provided by Sentieo.