This chart taken from my book, illustrates my equity research framework comprised of 4 factors that drive margin of SAFEty for an investment in a tech stock.
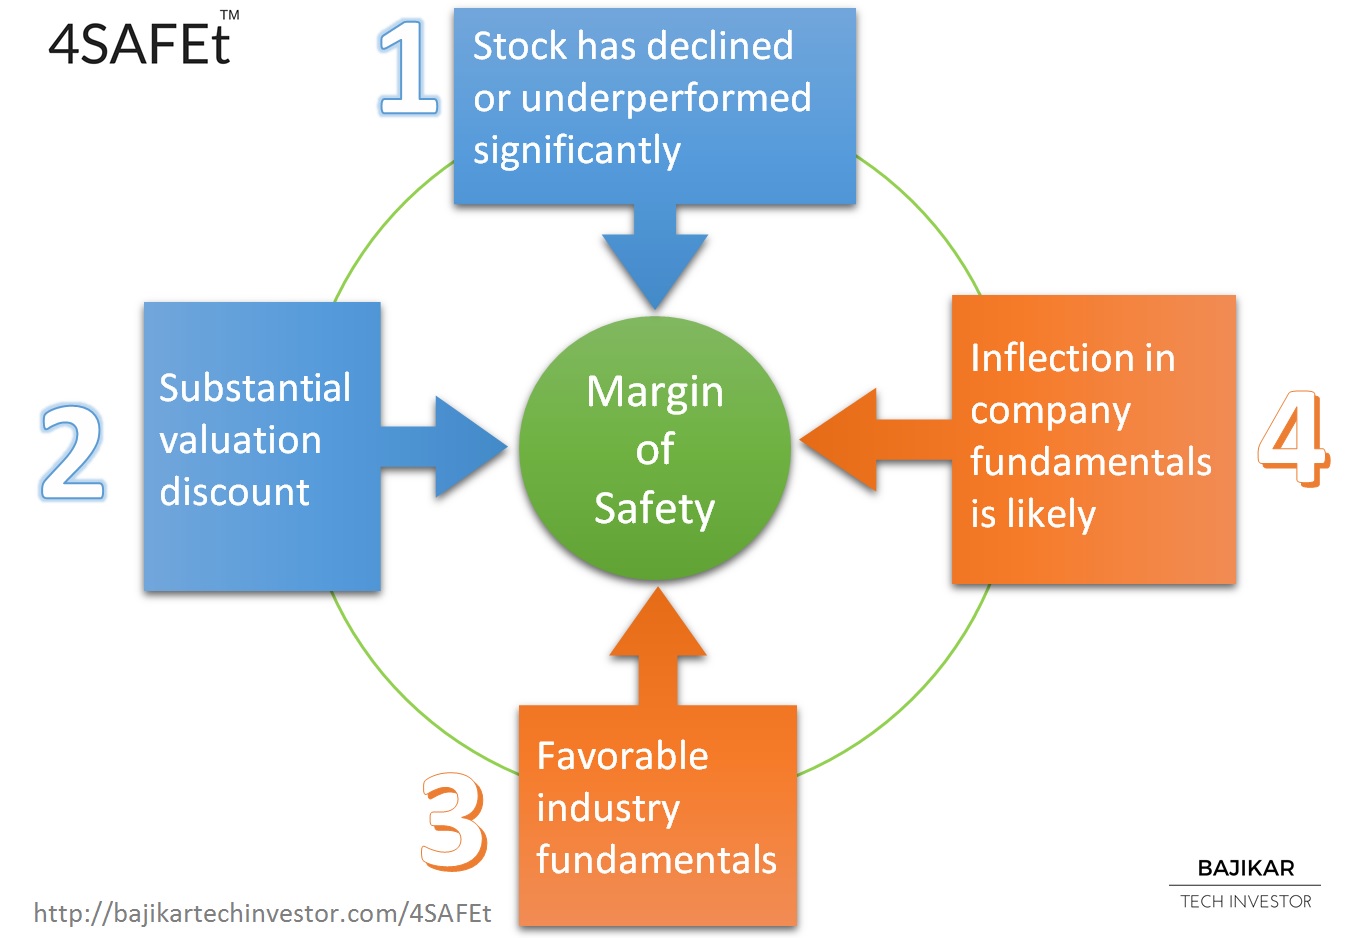
I learnt the concept of “Margin of Safety” in Benjamin Graham’s famous book “Intelligent Investor”, and modified Graham’s original process to come up with the 4SAFEt framework for tech stocks. Interestingly enough, some of the most respected value investors tend to avoid tech stocks, explicitly because they think tech stocks are too hard to analyze (I agree with them). This is probably why you are unlikely to find a lot of resources that focus on application of value investing to tech stocks. However I know there are successful practitioners of value investing in tech stocks – one of them is my friend Zack Perry, who runs Vine Street Capital Management, LLC.
Here’s what the 4SAFEt framework is comprised of:
- “S” – Stock has declined or underperformed recently
- “A” – Assessment of significant valuation discount
- “F” – Favorable industry conditions
- “E” – Earnings inflection is likely
Yes the “t” in 4SAFEt represents technology stocks, though I am confident this process could be applied to other specialty sectors like Pharma for example. Also, while I developed this process for publicly traded stocks, I believe the framework could be extended to investments in private companies as well.
Step #1 (“S”) is the easiest of the 4 steps in the 4SAFEt process, and involves establishing that the stock has declined or underperformed in the most recent period. “Recent period” most commonly refers to the last 3 months, 6 months or 1 year, but could just as well be any other time period relevant for the stock in question. I personally prefer to see a recent decline in absolute price of a stock, though there will be cases in which underperformance relative to a relevant index, most commonly the S&P 500 index, might be acceptable to fulfill step #1.
Step #2 (“A”) is a bit more tricky because assessing valuation tends to require looking at multiple different metrics, depending on the stock in question. I have most commonly used NTM P/E to judge valuation for the majority of the stocks I have analyzed, but have also used TTM EV/S, EV/FCF, and P/TBV for this purpose. As I discuss in my book, I am not a fan of using DCF valuation for tech stocks. In this step you are looking for two types of valuation discounts – (1) a discount relative to the stock’s historical valuation, and (2) a discount relative to valuation of the most applicable peer group. E.g. a stock that has historically most often traded at NTM P/E of 12x, would not necessarily be deemed to be trading at a discount if it is sporting a NTM P/E of 14x, even if that valuation might be below the long-term average multiple for the overall market (e.g. S&P 500).
Steps #3 and #4 are where you will do most of the hard work that will help you determine if a given stock is a worthy investment. I have emphasized in my book that having academic training in engineering or the sciences, and/or work experience in the tech industry is likely to put you in a position of advantage compared to the average investor, for successfully executing steps #3 and #4. Step #3 involves understanding industry structure, competitive dynamics, basis of competition, strategies of different players, underlying product and technology dynamics, cost structure economics, product cycles and other factors. The purpose of this analysis is to determine if the industry as a whole is likely to maintain or grow its profit pool over the investment horizon.
Step #4 involves determining whether company-specific dynamics would translate into a positive inflection (i.e. improvement) in earnings and/or free-cash-flow over the investment period, allowing the stock to unlock value. Even if steps #1, #2 and #3 are supportive of an investment, lack of conviction in earnings inflection could suggest that you have what’s commonly referred to as a “value trap” on your hands. Your company analysis may uncover a specific timing element that characterizes potential earnings inflection. Such information could be used to optimize your purchase price for the stock, should you decide to invest in it. Ultimately it is the purchase price that defines your margin of safety in the investment, relative to your assessment of intrinsic value.
Disclosures and Disclaimer